How to measure your digital loyalty programme

Measure a loyalty programme against the behaviour you wanted to change, using a defined customer group and time window. Track joining, active use, repeat visits, reward redemption and total costs. Separate programme-linked sales from additional sales: a purchase recorded through a loyalty card is not automatically a purchase caused by it.
Your first scorecard should answer three questions: are customers using the programme, are their recorded behaviours changing, and does the commercial result justify the cost?
Define success before launch
An objective might be: “Increase the proportion of new members who make a second qualifying visit within 30 days.” That gives you an event, a group and a window. The 30-day choice is illustrative; use your normal purchasing cycle.
Record the launch date, original reward rules and any later changes. Choose your first review date before seeing whether the early results look encouraging.
Build a programme scorecard
| Metric | Definition to use | Interpretation limit |
|---|---|---|
| Enrolments | New, deduplicated members during the period | Signup is not continued use |
| Activation | New members completing the chosen first qualifying action within a set window, divided by eligible new members | Joining-day activity may not represent a return |
| Second-visit rate | Members with a recorded second qualifying visit within the window, divided by the matured signup cohort | Exclude members who have not had the full window |
| Visit frequency | Qualifying visits divided by the defined customer group during a fixed period | Results change if you exclude inactive members |
| Time between visits | Elapsed days between recorded qualifying visits for a stated group | Customers with no return need separate reporting |
| Redemption rate | Eligible rewards redeemed within a stated window, divided by eligible rewards available in that window | Specify whether the denominator is rewards or people |
| Programme cost | Software, relevant messaging, reward delivery and administration costs | Avoid omitting staff time or counting the same cost twice |
Use a manageable set. A complete definition for five metrics is more useful than a dashboard full of unclear percentages.
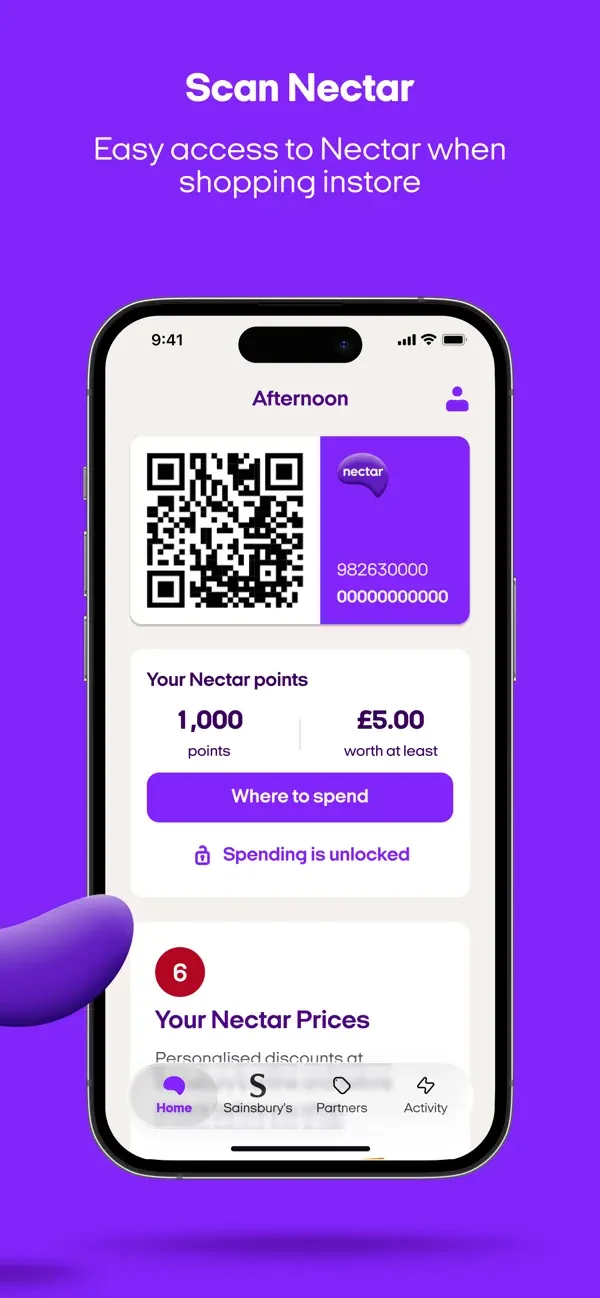
Nectar: a points balance is a participation measure
Nectar’s official screenshot displays the member’s card and points. These are useful programme measures, but the balance alone does not establish additional sales.
Source: Nectar programme · Official app screenshots.
A worked second-visit example
Suppose 120 customers joined in June. By the review date, every one has had 30 days to return. You recorded a second qualifying visit within that window for 48 members.
The second-visit rate for that matured cohort is 48 divided by 120, or 40%.
If the next cohort has a 45% rate under the same definition, that is five percentage points higher. The relative increase is 12.5%, calculated as 5 divided by 40. Those are two ways of describing the same change, not interchangeable percentages.
This example does not establish what caused the change. Seasonality, customer mix, staff recording, promotions or service changes could also matter.
Separate participation from impact
| Observation | What you can say | What needs more evidence |
|---|---|---|
| 200 people joined | The programme enrolled 200 people | Those people made additional purchases |
| £8,000 was recorded through cards | That activity was linked to programme records | The programme generated £8,000 of extra sales |
| Redeemers returned more often | Redeemers had higher recorded frequency | Redeeming caused the difference |
| The post-launch period improved | Performance improved during that period | The programme was the sole reason |
Members who choose to join can already be your strongest regulars. Comparing them with non-members without accounting for that difference can exaggerate the programme’s effect.
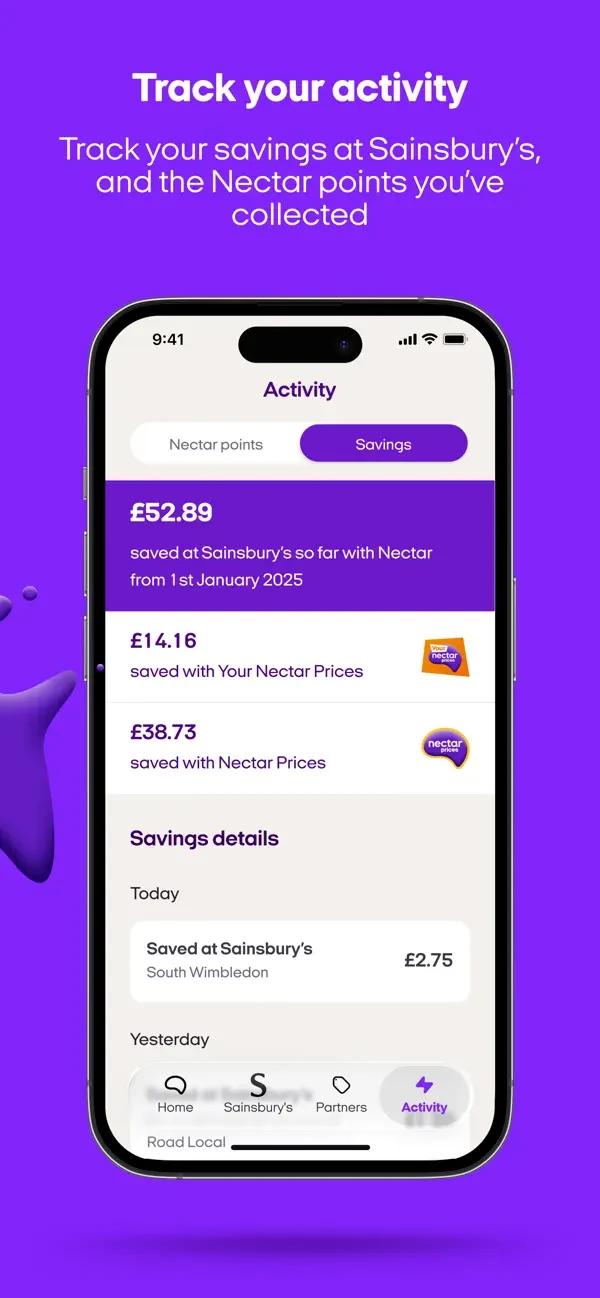
Separate recorded activity from programme impact
Nectar’s issuer-provided activity screen makes a member’s recorded savings and history visible. Measuring incremental impact still needs a suitable group, period and comparison.
Source: Nectar programme · Official app screenshots.
Choose a useful comparison
| Method | What it helps with | What to watch |
|---|---|---|
| Before and after | A simple view of change over time | Seasonality, price changes and recording differences |
| Successive signup cohorts | Whether the joining and early-return journey improves | Cohorts need the same follow-up window |
| Comparable customer groups | Differences between groups under similar conditions | Self-selection and unmeasured differences |
| Planned holdout or staggered launch | A stronger comparison of programme exposure | Fair implementation, sample size and contamination |
You do not need to pretend a small pilot is a controlled experiment. State the comparison, show the numbers and describe the practical limits.
Check the records first
Before interpreting a fall in visits, check whether staff were scanning. Before celebrating a rise in membership, check for duplicates. Before comparing spend, confirm that both periods use the same eligible transactions and treatment of refunds.
Keep enrolment and transaction records distinct. A person signing up and buying once has activated the programme; they have not necessarily completed a repeat visit.
MSTRMND’s recorded customer activity can support the scorecard. Some comparisons, costs and incremental-impact calculations may need exports or separate analysis. Do not assume every definition above is a ready-made dashboard metric.
Review contribution, not just revenue
Use an illustrative monthly calculation:
| Item | Example assumption |
|---|---|
| Estimated genuinely additional paid visits | 30 |
| Contribution per additional visit, after ordinary variable delivery costs | £8 |
| Additional contribution before programme costs | £240 |
| Software and relevant messaging | £60 |
| Staff administration | £30 |
| Reward delivery costs not already included | £50 |
| Total programme costs | £140 |
| Estimated contribution after programme costs | £100 |
The calculation is 30 × £8 − £140. Under these assumptions, contribution-based ROI is £100 divided by £140, or about 71%. This is hypothetical, depends on the estimate of additional visits, and is not a MSTRMND performance claim or price quote.
If you cannot estimate additional behaviour credibly, report participation and linked activity without relabelling them as ROI.
Diagnose the next change
| Pattern | Investigate first |
|---|---|
| Low signup | Offer clarity, placement of the QR code and staff explanation |
| High signup, low later use | Saving the card, staff prompts and the first reward journey |
| Many earned rewards, few redemptions | Reward appeal, restrictions and customer awareness |
| Rising activity, disappointing contribution | Reward cost, discounting and whether purchases are additional |
| Big differences between shifts | Scanner availability, training and recording consistency |
Pro tip. Keep a change log beside the scorecard. A new menu, price rise or booking policy can explain a result that would otherwise be credited to the loyalty campaign.
Frequently asked questions
What is the most important loyalty metric?
The one tied to your stated objective, supported by participation and cost checks. No single metric covers enrolment, customer behaviour and profitability.
How long should I wait before reviewing?
Allow the customer group a full opportunity to complete the behaviour. Use early process checks immediately, then assess returns over an appropriate purchasing cycle.
Should I count all member revenue as programme revenue?
You can label it programme-linked revenue if it was recorded through the scheme. That does not establish that the programme caused it.
Why use a matured cohort?
Customers who joined yesterday have not had 30 days to return. Mixing them into a 30-day second-visit denominator makes the result difficult to interpret.
Is a high redemption rate always good?
No. It can indicate an appealing reward, but also a costly offer. Review customer behaviour, delivery costs and the programme objective alongside it.
Can I compare members with non-members?
Yes, as a descriptive comparison with appropriate limits. People who join may differ from those who do not, so the difference is not automatically a causal effect.
Does MSTRMND calculate all these metrics automatically?
The platform records relevant loyalty activity, but the available reports depend on your setup. Confirm specific metrics, data exports and required calculations during a demo.
Set up a scorecard you can trust
Discuss your measurement goals or return to the programme design checklist.